From Compliance to Competitive Advantage: The Business Case for Corporate Decarbonization
A case study on building the business case for corporate decarbonization, using scenario analysis and a marginal abatement cost curve to map a fictional airline's path to net zero.


The global policy landscape for climate action is shifting. Priorities are being redrawn across major economies, with surging AI energy demand adding new pressure on climate commitments. In Europe, the Omnibus package and its ‘stop-the-clock’ mechanism have already delayed and scaled back flagship Green Deal measures. Meanwhile, mounting political and legal pressure has seen major banks exit the Net-Zero Banking Alliance, effectively winding it down. These developments underscore the urgency for businesses to build a strong case for net-zero offerings. As companies balance ambitious environmental goals with financial imperatives, corporate decarbonization has become a critical strategy for long-term competitiveness.
This blog explores how organizations can integrate net-zero offerings into their operations, leveraging technology to navigate challenges and capitalize on opportunities in the transition to a low-carbon economy.
Beyond Compliance: From Regulation to Climate Resilience
The Shift from Compliance to Resilience
Climate change has evolved from a distant threat to a pressing business reality, with growing consequences for global operations, supply chains, and communities. For organizations, building resilience is about thriving amid uncertainty. Climate resilience requires bold leadership that embeds sustainability into core strategy.
Organizations must move beyond treating climate risk management as a compliance checkbox. While regulatory pressure may catalyze action, relying solely on compliance is reactive and shortsighted. Proactive adaptation enables companies to identify strategic opportunities, safeguard their assets and maintain stakeholder trust.
Climate risk is business risk. Disruptions from ecosystem degradation, resource scarcity and extreme weather are rising, and so are the financial costs. For companies reliant on natural capital, the threat is existential. To thrive, sustainability must be treated not as an add-on but as a core strategic pillar, fully embedded into corporate governance, planning and operations.
This shift also requires a new mindset, one focused on transforming how business is done. Companies that integrate sustainability into decision-making will outpace those stuck in reactive compliance mode.
Markets Still Reward Climate Leadership
This shift is reinforced by market signals. Businesses investing in sustainability today are responding to clear incentives from investors, customers and employees. In BDO's 2025 CFO Sustainability Outlook Survey, conducted after the recent US election, 44% of finance leaders planned to increase sustainability investment, citing benefits like innovation, new business opportunities, revenue growth and access to favorable financing. Meanwhile, PwC's Voice of the Consumer survey finds shoppers are willing to pay nearly 10% more for sustainably produced goods, even with cost-of-living pressures.
Green talent is in demand, too. LinkedIn's 2025 Green Skills Report shows green hiring growing at 7.7% year-over-year, nearly double the 4.3% growth in green skills across the workforce, and workers with green skills now enjoy a hiring rate 46% higher than the global average. OnePointFive's analysis of the report puts it plainly. We cannot hire our way out of this shortage, which means upskilling the existing workforce is now the priority.
This trend underscores that sustainability expertise is becoming a key differentiator in the global job market and one that is getting harder to buy than to build.
What is corporate decarbonization?
At its core, decarbonization means reducing the greenhouse gas emissions generated by human activities. Corporate decarbonization, therefore, focuses on cutting the emissions generated across an organization’s own operations and value chain, covering Scope 1, 2 and 3 emissions.
Sounds straightforward, right? The real challenge lies in achieving decarbonization while simultaneously improving financial performance and reducing costs.
But decarbonization isn’t just about preventing a "catastrophe." It also presents a major economic opportunity. By investing in green technologies and sustainable industries, businesses can stimulate economic growth. Transitioning to renewable energy, for example, not only reduces carbon emissions but also creates jobs, promotes innovation, and enhances energy independence, demonstrating that environmental responsibility and economic progress can go hand in hand.
Balancing Sustainability and Profit
Achieving net-zero goals is often seen as a financial burden, but in reality, strategic decarbonization can drive both environmental and economic benefits. Carbon fluency involves a deep understanding of carbon footprints, the total greenhouse gas emissions an organization is responsible for, and carbon handprints, which represent the positive impact of actions taken to reduce emissions. This knowledge empowers organizations to make informed decisions that not only minimize their environmental impact but also enhance operational efficiency and market competitiveness.
Building on my experience at OnePointFive Academy, I revisited a case study I worked on during the fellowship. This time, I took it a step further by exploring how organizations can strengthen the business case for net-zero offerings using the Marginal Abatement Cost Curve (MACC) and decarbonization scenario analysis.
Cost vs. Investment
While decarbonization comes with upfront costs, tools like the MACC help businesses identify opportunities where emissions reductions align with financial returns. By prioritizing the most cost-effective abatement measures, companies can transform sustainability efforts from a perceived expense into a long-term investment.
Voyager Airlines is a large commercial airplane operator headquartered in Frankfurt, Europe. It offers more than 1,205 daily departures with destinations spanning 89 countries.
Due to tightening regulations, changing consumer demands and new market opportunities, Voyager Airlines wants to launch a decarbonization strategy. The C-Suite is highly motivated to "do right" on sustainability. However, with industry peers increasingly held under the limelight for greenwashing and with uncertainty about cost, they are concerned about how to implement a sustainability strategy.
N.B: This is a fictional company and I made several assumptions to enable me to work on the project
Company Profile 2023: Operating Statistics (Assumptions)
- Daily Flights: 1,205
- Destinations: 89 countries
- Fleet Size: 280 aircraft
- Annual Passengers: 42 million
- Revenue: €15.8 billion
- Employees: 38,000
Project Scope and Objective
Build a decarbonization scenario analysis to
- Identify abatement potential and costs of key decarbonization initiatives.
- Build a MACC to assess the relevance and phasing of the top 10 initiatives.
- Identify the priority decarbonization initiatives to pilot.
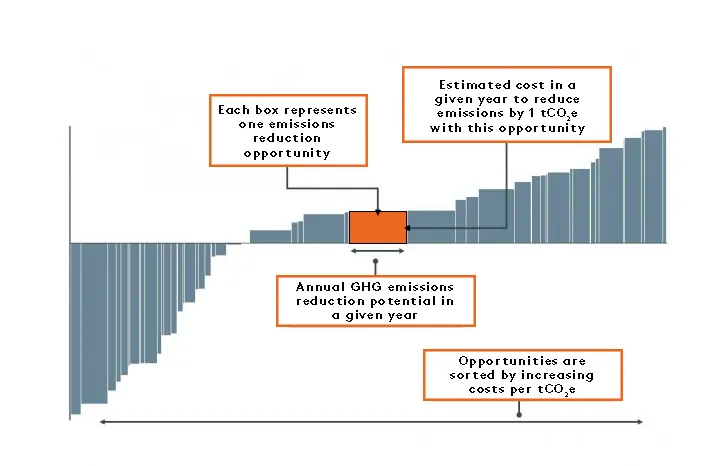
First, some definitions.
Current Targets
Voyager Airlines has committed to the Science-Based Targets Initiative (SBTi) and set the following targets:
- Near-term (2030): 50% reduction
- Long-term (2050): 90% reduction
A note on timing: this analysis was built under the SBTi Corporate Net-Zero Standard Version 1.3.1. In June 2026, SBTi published Version 2.0, which takes effect from 31 January 2027 and becomes mandatory for all new targets from January 2028. Under V2.0, companies set separate Scope 1 and Scope 2 targets rather than a combined one, large companies face mandatory assurance and published transition plans, and target setting moves to continuous five-year cycles. A company running this exercise today would need to disaggregate the blended target below. The methodology that follows still holds, but the target architecture would look different.
Challenges
- Meet investor demands for climate action
- Comply with upcoming regulations
- Reduce operational costs
- Address customer sustainability requirements
Analysis Process
Step 1: Emissions Inventory (Assumptions based on Average Airline Emissions)
The first step for Voyager Airlines is to measure and calculate its greenhouse gas emissions. I made assumptions for Scope 1, 2, and 3 based on emissions profiles of major carriers. American Airlines is a useful reference point. In its 2024 Sustainability Report, direct emissions from jet fuel dominate the footprint, and reporting on the airline's disclosures puts Scope 1 at roughly 72% of total emissions. Broader research across the largest airlines finds Scope 3 typically adds around 30% on top of direct emissions, though reporting remains inconsistent across the sector.
Building a baseline like this depends on tracing emissions to their actual sources, work that gets granular fast. I went through that exercise at product level in a life cycle assessment of a PET bottle in Nigeria, mapping where emissions accumulate from raw material through to disposal. The same discipline underpins the Scope 3 categories that make up more than a quarter of Voyager's footprint.
Total Annual Emissions: 36.99 MtCO2e
- Jet fuel Combustion/aircraft and ground operations (Scope 1): 72.5% (26.8 MtCO2e)
- Electricity for ground operations (Scope 2): 0.3% (0.09 MtCO2e)
- Fuel supply chain, waste, business travel and other value chain activities (Scope 3): 27.2% (10.1 MtCO2e)
Figure 1: Voyager Airlines emissions by scope, 2023 baseline. Total 36.99 MtCO₂e across Scope 1, 2 and 3.
Step 2: Identified Reduction Initiatives
- Increase aircraft fleet efficiency
- Improved departure and arrival planning
- Improve route planning
- Minimize flaps (take-off & landing)
- Electrify gate operations
- Bio-based sustainable fuels
- Hydrogen-based sustainable fuels
- Consumers' climate-positive behavior
- Fleet operators' climate-positive behavior
- Improve customer experience
Scenario Analysis
Now that we have established Voyager Airlines' 2023 baseline emissions and set near-term (50% reduction by 2030) and long-term (90% reduction by 2050) targets, the next step is to prioritize and implement emission reduction actions. I used scenario analysis to explore potential climate futures and assess the impact of different decarbonization strategies.
What is scenario analysis? It is a strategic tool that allows businesses to evaluate the implications of different climate and policy scenarios on their operations and emissions. It involves creating multiple scenarios, each representing a distinct pathway based on varying degrees of climate action and regulatory change.
Scenario 1: Business as Usual (BAU)
The BAU scenario asks a simple question. What happens to Voyager's emissions if the airline does nothing?
My first instinct was to anchor BAU to economy-wide EU emissions projections, but that turns out to be the wrong lens for an airline. The EU economy as a whole is projected to stay broadly flat, while aviation is one of the fastest-growing emissions sources in the bloc. Applying an economy-wide trend to an airline produces a flat BAU line, which badly understates the problem.
Instead, I modeled Voyager's BAU on aviation sector growth. I applied the roughly 2.5% annual growth implied by IBA's baseline emissions forecast, which projects commercial passenger aviation emissions rising 87% between 2025 and 2050 as traffic growth outpaces fleet renewal. Notably, that forecast has emissions intensity improving by around 20% over the period, so the aircraft do get more efficient. Demand growth simply outruns the gains.
How the model is built: The 2.5% is applied to total emissions, not to passenger numbers, so the fleet-renewal efficiency gains embedded in IBA's forecast are already netted out. Emission factors are held constant, SAF penetration is assumed to stay at today's negligible levels and no policy shift is priced in. The result is a deliberately conservative counterfactual, not a forecast.
On that basis, Voyager's trajectory looks like this:
- 2023 baseline: 36.99 MtCO₂e
- 2030: approximately 44.1 MtCO₂e
- 2040: approximately 56.8 MtCO₂e
- 2050: approximately 73.0 MtCO₂e
In other words, doing nothing nearly doubles Voyager's footprint by 2050. That rising line, not a flat one, is what makes the target pathway meaningful.
For context, EU economy-wide projections from the Peterson Institute for International Economics show regional emissions holding relatively steady, from 4,070 MtCO₂ in 2020 to 4,143 MtCO₂ in 2040 and 4,101 MtCO₂ in 2050. Voyager is therefore growing its emissions against a flat regional backdrop, which is precisely why aviation attracts disproportionate regulatory attention.
Scenario 2: Target Pathway
The Target Pathway represents Voyager's own climate targets: a 50% reduction from the 2023 baseline by 2030 and a 90% reduction by 2050, achieved through sustainable aviation fuels, operational efficiency, and investment in new technologies. Measured against BAU rather than against the baseline, the required abatement by 2050 is considerably larger than the headline 90% suggests, since the airline must also neutralize the growth it would otherwise have added. Against a BAU of 73.0 MtCO₂e, hitting 3.7 MtCO₂e means abating roughly 69 MtCO₂e a year.
Scenario 3: 1.5°C Pathway
The 1.5°C Pathway aligns Voyager Airlines’ emissions trajectory with the Paris Agreement’s goal of limiting global warming to 1.5°C above pre-industrial levels. This science-based pathway generally requires an average annual emissions reduction of approximately 7% year-over-year, representing a rapid and sustained decarbonization effort.
Emissions Reduction Pathway
To act on these scenarios, it is important to understand where Voyager Airlines’ carbon footprint is concentrated. The top five emissions hotspots highlight key areas for targeted action:
- Jet fuel consumption, the largest source of direct (Scope 1) emissions.
- Aircraft purchases contribute substantially to Scope 3 emissions, reflecting energy-intensive manufacturing processes behind each plane.
- Purchased goods and services, including catering, onboard amenities, and IT systems.
- Waste management, from in-flight food waste to hazardous materials, also plays a role in Scope 3 emissions depending on disposal methods.
- Electricity use in offices and lounges (Scope 2), particularly where energy comes from fossil fuels.
Breaking total emissions down across these sources gives a clearer picture of where reductions must occur. Jet fuel consumption dominates at 26.8 MtCO₂e. Aircraft purchases (Scope 3, capital goods) are estimated at 3.03 MtCO₂e, assuming 30% of total Scope 3. Purchased goods and services contribute approximately 1.52 MtCO₂e (15% of Scope 3). Waste is relatively small at 0.10 MtCO₂e (1% of Scope 3), and electricity use is 0.09 MtCO₂e.
Figure 2: Projected emissions reductions for Voyager Airlines' top five hotspots, 2023–2050. Target Pathway shown across the five largest emission sources.
Those five sources sit inside Voyager's total footprint. The chart below shows how that footprint moves under each of the three scenarios.
Figure 3: Voyager Airlines emissions pathways, 2023–2050. Target Pathway shown against Business as Usual and the 1.5°C Pathway.
At the far right of the chart, the 1.5°C line finishes just above the top of the 2050 bar. That's the shape of the curve, not a lack of ambition. Cutting 7% a year front-loads the work, so the 1.5°C route demands much deeper cuts before 2030 than Voyager's own target does, and it's the early years that decide the cumulative total.
Marginal Abatement Cost Curve (MACC)
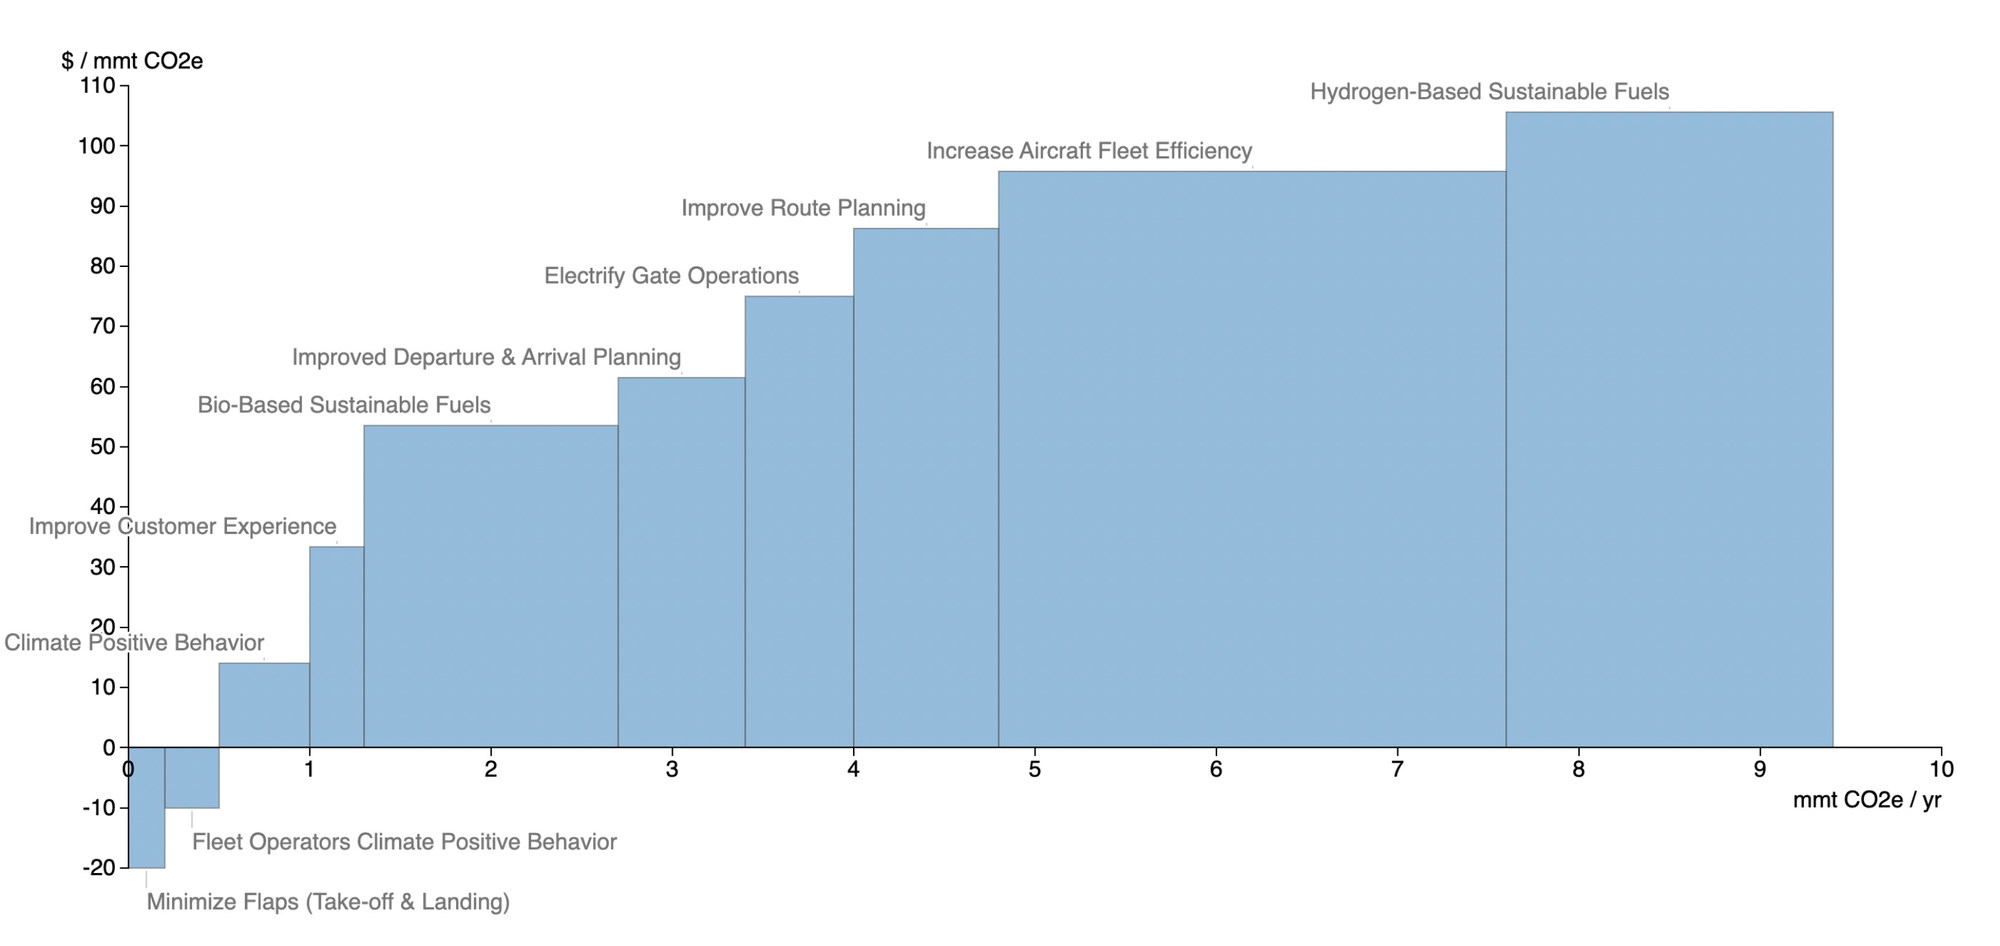
With the emissions baseline and reduction pathway defined, the next step is to assess how these reductions can be achieved in practice. To identify the most effective and cost-efficient abatement opportunities, I developed a MACC that maps each initiative by its abatement potential (mmt CO2 / yr) and total cost. Estimates were derived using a combination of benchmarks from OnePointFive Academy (OPF) and independent calculations.
Each initiative's abatement cost is the net present value of its incremental capital and operating costs, less any fuel or operational savings it generates, divided by the tonnes it abates over the investment period. Initiatives are costed independently, so overlapping measures would need netting off before the totals are summed. A full breakdown of assumptions and NPV estimates is available here.
Table 1: Key decarbonization initiatives with estimated abatement potential and total abatement cost, following OPF's methodology. Units follow the original analysis (mmt CO₂ = million tonnes of CO₂). Negative costs indicate net savings over the investment period.
| Initiative | Abatement Potential (mmt CO2 / yr) | Total Abatement Cost (€ million) |
|---|---|---|
| Increase Aircraft Fleet Efficiency | 2.8 | 268 |
| Improved Departure & Arrival Planning | 0.7 | 43 |
| Improve Route Planning | 0.8 | 69 |
| Minimize Flaps (Take-off & Landing) | 0.2 | -4 |
| Electrify Gate Operations | 0.6 | 45 |
| Bio-Based Sustainable Fuels | 1.4 | 75 |
| Hydrogen-Based Sustainable Fuels | 1.8 | 190 |
| Consumers Climate Positive Behavior | 0.5 | 7 |
| Fleet Operators Climate Positive Behavior | 0.3 | -3 |
| Improve Customer Experience | 0.3 | 10 |
Using this data, I constructed the MACC using the open-source tool available online.
Figure 4: Marginal Abatement Cost Curve for Voyager Airlines' Top Emissions Hotspots
Priority Reduction Initiatives
While the MACC presents a full spectrum of decarbonization options, including some that are less cost-effective, it helps identify high-priority initiatives based on a balance of abatement potential, cost, and strategic relevance. From this analysis, I identified four initiatives for Voyager, split into short-term and mid-to-long-term implementation phases.
A. Short-term
- Induce Climate Positive Behaviour with Fleet Operators:
It would be great to start with this behavioral approach, as a low-hanging fruit can deliver immediate emissions reductions without requiring significant capital investment, making it an attractive initiative that complements longer-term technological and fleet modernization strategies.
C-suite priorities: Potential to deliver immediate fuel-cost savings with minimal investment. Could create a quick win that funds longer-term sustainability investments, and also appeals to cost-conscious decision-makers due to its low implementation costs and measurable ROI in both fuel savings and emissions performance.
Implementation: Voyager can start with this. Roll out training programs for pilots and ground crews focused on fuel-efficient operations, combined with real-time emissions feedback and gamified performance tracking to drive sustained behavioral change across all fleet operations. - Improving the Departure and Arrival Planning
C-suite priorities: Ground operations are an often-overlooked emissions hotspot. Roland Berger estimates that aircraft standing and taxiing account for around 24% of the Scope 3 emissions airports can influence, and that the full arrival and departure process makes up roughly 55% of an airport's total footprint. For an airline, taxiing is a smaller slice, typically under 5% of its own emissions, but it is among the cheapest to address. Reducing fuel burn during these phases cuts costs without fleet overhauls and improves schedule reliability for customers.
Implementation: Focus on high-traffic airports within Voyager’s network. Partner with airport operators and ATC to implement Collaborative Decision-Making (CDM) and pre-departure sequencing tools that minimize taxi times. Invest in real-time turnaround analytics to reduce idle time at gates and enable faster, more efficient pushbacks. Prioritize routes and hubs where congestion is most acute, that is where operational gains will drive the greatest carbon and cost savings. Tools like AI-driven sequencing and turnaround analytics are making these operational gains achievable at a scale that wasn't possible five years ago.
B. Mid- to Long-term
- Switch to Bio-based Sustainable Fuels
C-suite priorities: Petroleum-based jet fuel accounts for over 90% of Voyager’s value chain emissions. Transitioning to bio-based Sustainable Aviation Fuels (SAFs) offers a pathway to reduce lifecycle GHG emissions by at least 60%. With the EU’s ReFuelEU Aviation regulation mandating a 2% SAF blend from 2025, rising to 70% by 2050 (including synthetic fuel quotas), Voyager should aim for 5–10% SAF usage by 2030, scaling to 50–70% by 2050. This aligns with regulatory expectations, mitigates long-term compliance risk, and positions the airline as a climate-forward industry player.
Implementation: Phased approach of SAF adoption on EU-linked routes to comply with region-specific mandates. Prioritize partnerships with sustainability-certified suppliers and explore long-term offtake agreements. Evaluate joint investments in SAF production infrastructure where feasible to manage future costs and supply security. Ensure feedstock sourcing avoids sustainability trade-offs such as deforestation or land-use change. - Increase aircraft fleet efficiency
C-suite priorities: This could be the right moment to consider replacing the aging fleet, however, proper contractual follow-up with suppliers should be held to ascertain their labor practices and supply chain. Modernizing Voyager’s aircraft fleet presents a clear opportunity to cut emissions at the source. While this is a capital-intensive, mid-to-long-term initiative, each new generation of aircraft offers a 15 to 20% improvement in fuel efficiency per passenger-kilometer compared to older models. For a fleet heavily reliant on conventional jet fuel, this transition is key to decoupling emissions from growth, though as the BAU scenario shows, efficiency alone will not outrun demand. Beyond the environmental benefits, future fleet decisions also carry reputational weight. Voyager’s current aircraft supplier has not substantiated claims regarding labor standards and does not disclose key ESG metrics. With increasing scrutiny from regulators, investors, and the public, tying capital decisions to both climate and social performance will be essential.
Implementation: Develop a multi-year fleet transition roadmap that prioritizes retiring the least efficient aircraft and targets routes where upgrades yield the greatest impact. Revise supplier contracts and procurement criteria to incorporate ESG performance, including labor standards. Engage with manufacturers and lessors offering low-emission aircraft, positioning Voyager to diversify into hydrogen or hybrid technologies as they mature. Finally, adopt a responsible end-of-life strategy for retired planes, through resale, parts recovery, or recycling, to minimize disposal impacts and demonstrate circular-economy principles.
Beyond Compliance: Sustainability as a Business Imperative
For companies aiming to stay competitive, decarbonization should no longer be just a compliance exercise, it must be a catalyst for innovation and growth. The businesses that thrive will be those that integrate sustainability into their core strategy, reducing costs, driving efficiency, and creating long-term value. The Voyager analysis shows what that looks like in practice, where the cheapest abatement turned out not to be the most technological.
Rather than waiting for regulatory pressure, which is increasingly uncertain in today's policy environment, forward-thinking companies are already leveraging low-carbon solutions to unlock new markets and strengthen their competitive edge.
References
- BDO, 2025 CFO Sustainability Outlook Survey (via ESG Today): https://www.esgtoday.com/more-than-75-of-cfos-expect-to-increase-or-maintain-sustainability-investment-after-trump-election-bdo-survey/
- PwC, Voice of the Consumer Survey 2024: https://www.pwc.com/gx/en/issues/c-suite-insights/voice-of-the-consumer-survey/2024.html
- LinkedIn Economic Graph, Green Skills Report 2025: https://economicgraph.linkedin.com/research/global-green-skills-report
- OnePointFive, Cutting Through the Green Noise: The 2025 Global Green Skills Gap: https://www.opf.degree/insights/cutting-through-the-green-noise-the-2025-global-green-skills-gap
- American Airlines, 2024 Sustainability Report: https://s202.q4cdn.com/986123435/files/images/esg/American-Airlines-Sustainability-Report-2024.pdf
- ESG Dive, American Airlines CEO sounds alarm on aviation sector decarbonization: https://www.esgdive.com/news/american-airlines-ceo-sounds-alarm-aviation-sector-decarbonization-esg-report-net-zero/720877/
- Gössling & Humpe, Are emissions from global air transport significantly underestimated?, Current Issues in Tourism: https://www.tandfonline.com/doi/full/10.1080/13683500.2024.2337281
- IBA, Emissions Forecast: Traffic Growth Outpaces Fleet Renewal Improvements: https://www.iba.aero/resources/articles/emissions-forecast-traffic-growth-outpaces-fleet-renewal-improvements/
- Peterson Institute for International Economics, BAU emissions projections for major economies: https://www.piie.com/publications/chapters_preview/6079/02iie6079.pdf
- Roland Berger, Accelerating airport decarbonization: https://www.rolandberger.com/en/Insights/Publications/Accelerating-airport-decarbonization.html
- Roland Berger, Ground-level decarbonization initiatives for airport platforms: https://www.rolandberger.com/en/Insights/Publications/Green-taxiing-initiatives-environmental-financial-business-and-operational.html
- Science Based Targets initiative, Corporate Net-Zero Standard Version 2.0: https://sciencebasedtargets.org/corporate-net-zero-standard-v2
- World Economic Forum, How CEOs can bridge the corporate cost of climate inaction (2024): https://www.weforum.org/stories/2024/12/ceo-bridge-corporate-cost-climate-inaction/
- European Commission, Omnibus simplification package: https://ec.europa.eu/commission/presscorner/detail/en/ip_25_614
- Council of the EU, Stop-the-clock mechanism press release: https://www.consilium.europa.eu/en/press/press-releases/2025/03/26/simplification-council-agrees-position-on-the-stop-the-clock-mechanism-to-enhance-eu-competitiveness/
- European Commission, ReFuelEU Aviation Regulation (EU) 2023/2405: https://eur-lex.europa.eu/eli/reg/2023/2405/oj
- IATA, Net Zero 2050: Sustainable Aviation Fuel: https://www.iata.org/en/programs/sustainability/flynetzero/